About Cor Capital
We specialise in managing and further developing our proven multi-asset investment strategy via the Cor Capital Fund. The genesis of our business was in response to the need for an uncomplicated but robust and liquid absolute return investment alternative in the post-GFC environment.
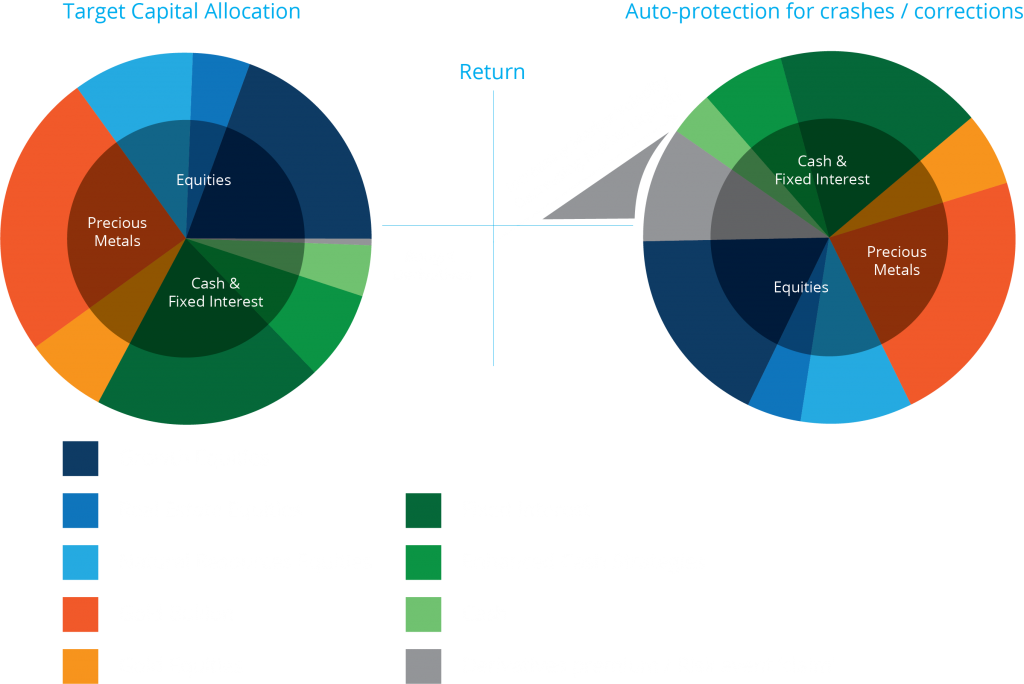
To that end, we invest across equities, fixed interest, precious metals, and cash markets, systematically combining asset classes (unconventionally) into a growth solution that minimises medium-term drawdowns.
• Straightforward investment philosophy
• Defensive focus
• Alternative return sources
• Disciplined, rules-based approach
• Experienced team
• Proven track record
• Strong alignment of interests with investors
Our name ‘Cor’ is the Latin word for heart. It reflects the value we place on authenticity and underscores the importance of the capital we manage on behalf of our investors.
For more information on the scheme and mandates currently offered, please contact us on 03 9221 6255 or contact us via the Connect page.
This business structure ensures efficiency and accountability and gives Cor access to vast resources when required. As a majority employee-owned firm, we view employee equity ownership and fund investment as important to developing a
culture of stability and aligned interests.
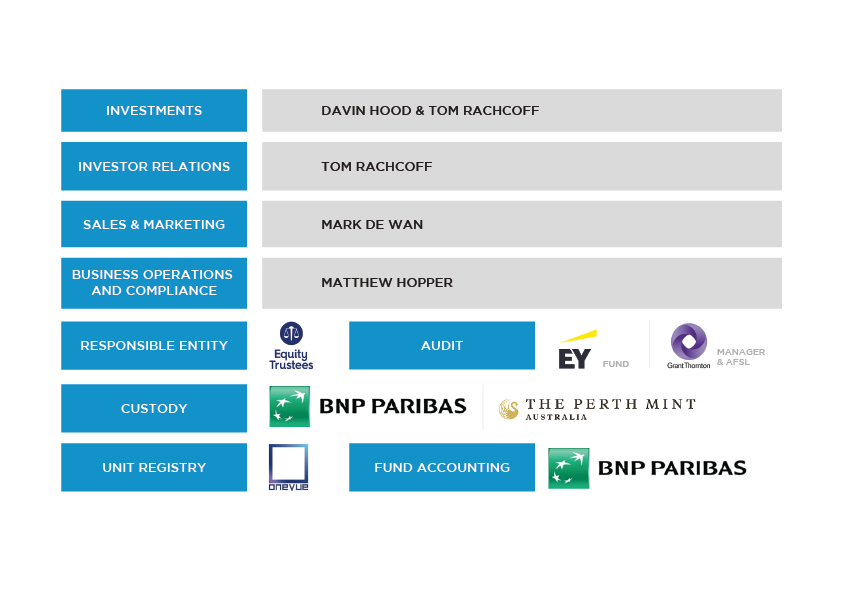
DAVIN HOOD - Managing Director
TOM RACHCOFF - Executive Director
MARK DE WAN - Head of Sales and Marketing
Phone: +61 409 501 488
Email: mark.dewan@corcapital.com.au
MATTHEW HOPPER - General Manager
Our Investment Approach
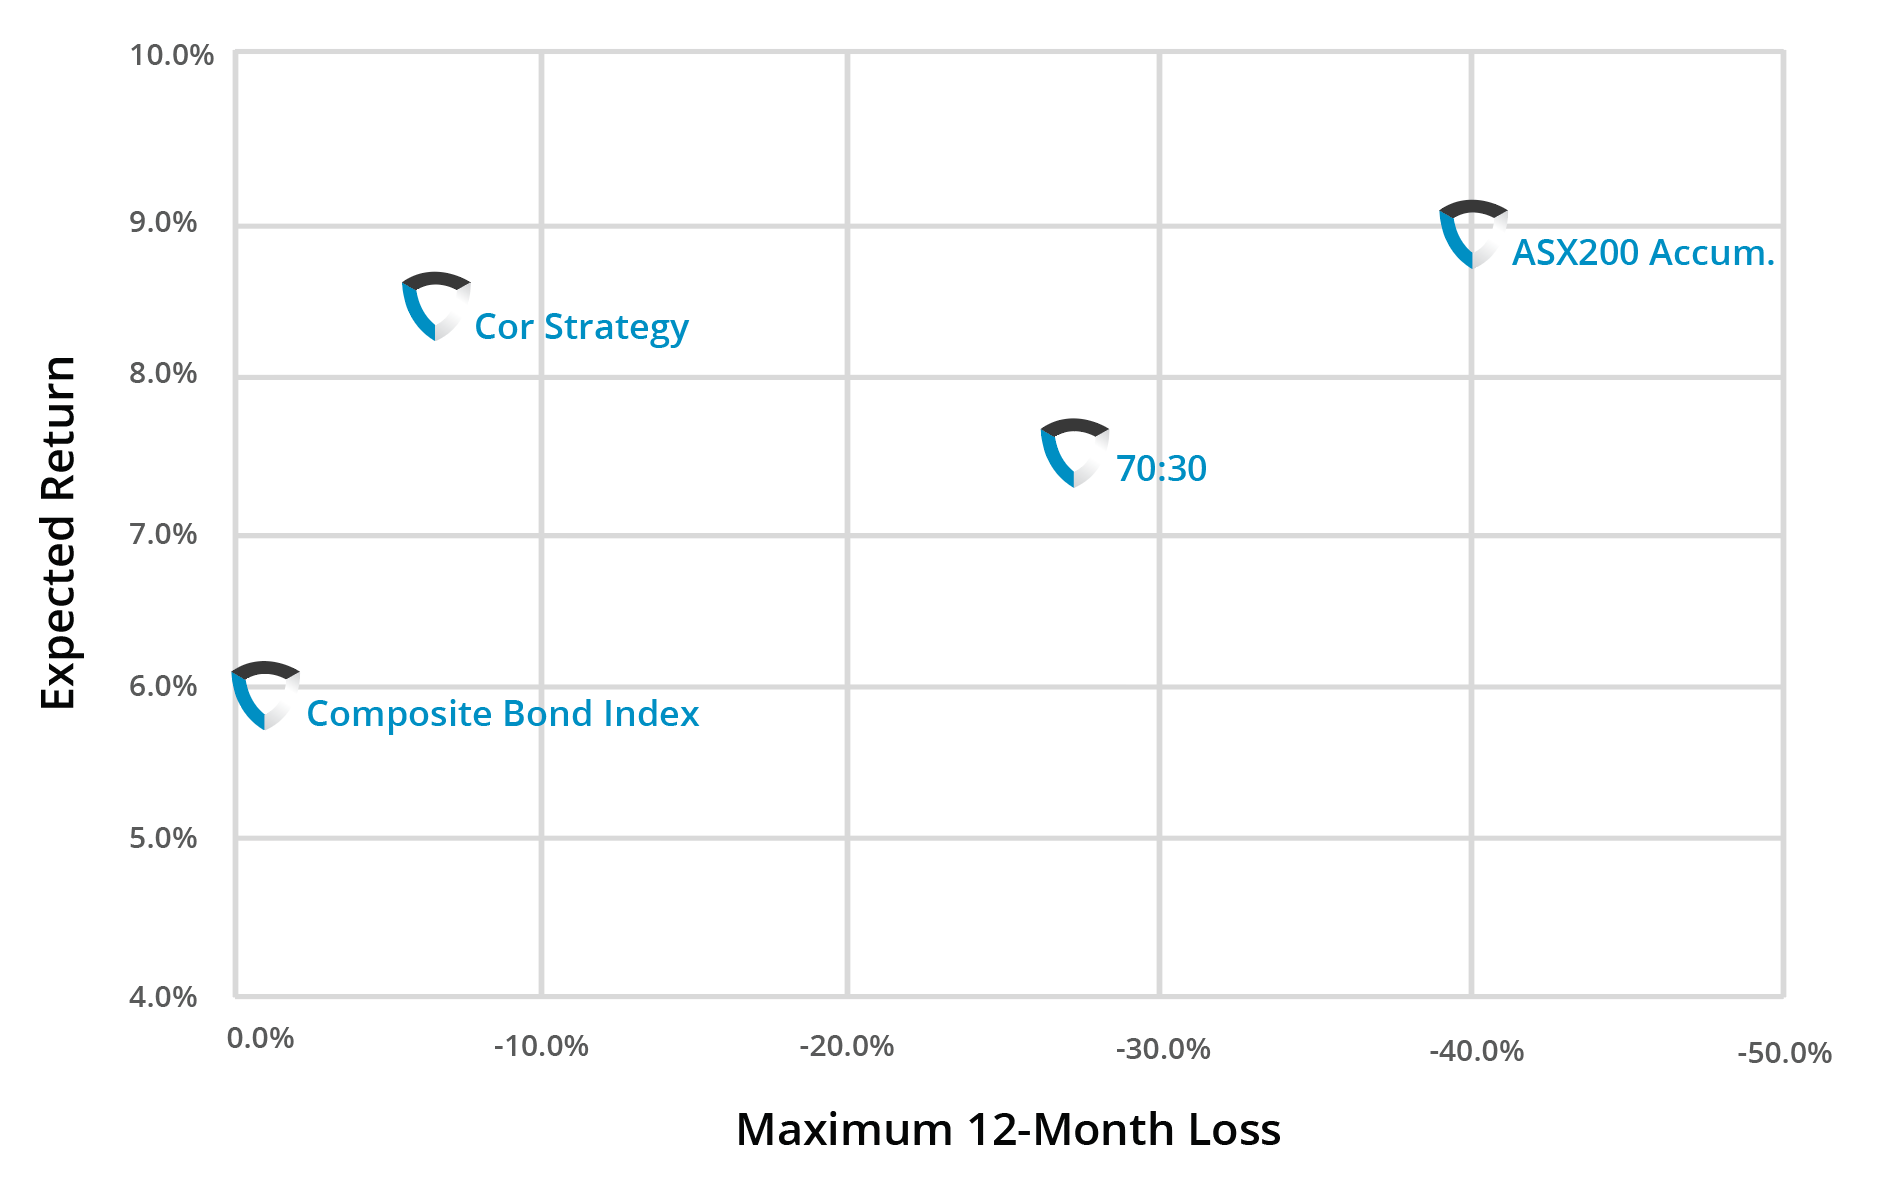
The Cor Capital Fund therefore seeks to protect and grow real wealth with less risk of capital draw down, filling the void between cash deposits and longer-term or less-liquid investments such as stocks or real-estate.
However economic and market outcomes are not arbitrary; while very different in nature and critically consequential to investor wealth, the range of possible scenarios is limited.
Because the behavioural responses of general market participants to each outcome are somewhat predictable, real positive medium-term returns can be achieved by doing the following:
- Diversifying broadly across the main growth and inflation risks (assumption: every asset class has its day)
- Rebalancing risk regularly (assumption: making contrarian adjustments adds to returns)
- Adding selective asymmetry to certain asset classes
- Focussing on volatility capture throughout the portfolio
- Optimising for friction costs
- 100% systematic / rule-based implementation
Highly intuitive and robust to origin or regime, it involves matching asset classes to highly consequential but opposing economic and market forces. For example: aggressive monetary policy, unintended policy consequences, carry bubble, carry crash, real economic growth.
We believe this macro-level design and ongoing management process increases the likelihood of portfolio growth across a broad range of environments, whether evolving slowly or explosive in nature.
Asset class returns are driven by changes to expected future outcomes
| Asset Class | Favourable Environment | Unfavourable Environment |
| Equities | Strong economic growth Increasing confidence Falling discount rate | Strongly increasing inflation Outright deflation Low confidence/High anxiety |
| Fixed Interest | Moderate growth Deflation Falling discount rate | Strongly increasing inflation Increasing credit risk Rising discount rates |
| Cash | Tight credit environment Deflation Rising discount rates | Strong Inflation Economic boom |
| Precious Metals | Rising inflation rates Outright Deflation Falling investor confidence Low real interest rates | Rising confidence Positive or rising real interest rates |
- Defensive first – Cash, Bonds and Precious Metals (AUD) combine to underscore capital preservation and purchasing power
- Growth via diversified equity exposure improves risk adjusted returns and outperformance relative to market index
- Risk Insurance via bought derivatives portfolio adds to defensive / long volatility characteristics (e.g. stock index put options, gold call options, USD call options)
- Non-correlation is more reliable between broad asset classes (e.g. gold bullion / equities) than specific exposures (e.g. US defensive / growth stocks), enabling more efficient return from active re-balancing and volatility capture
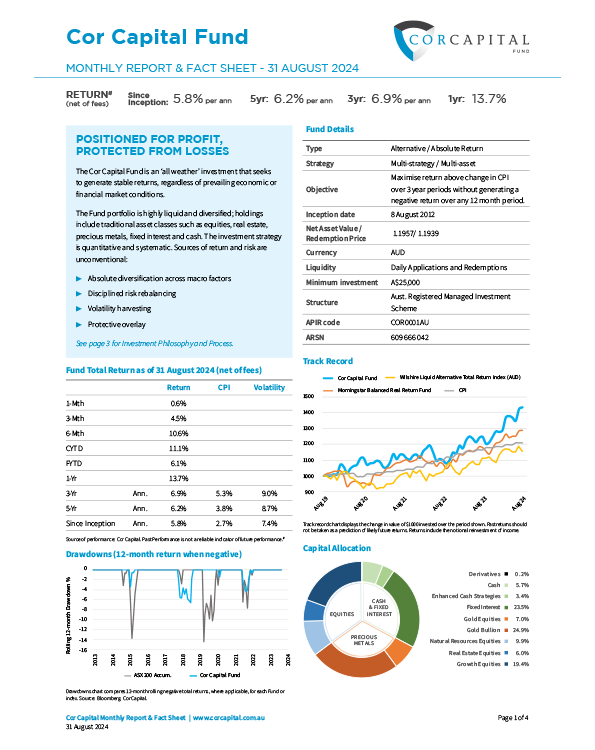
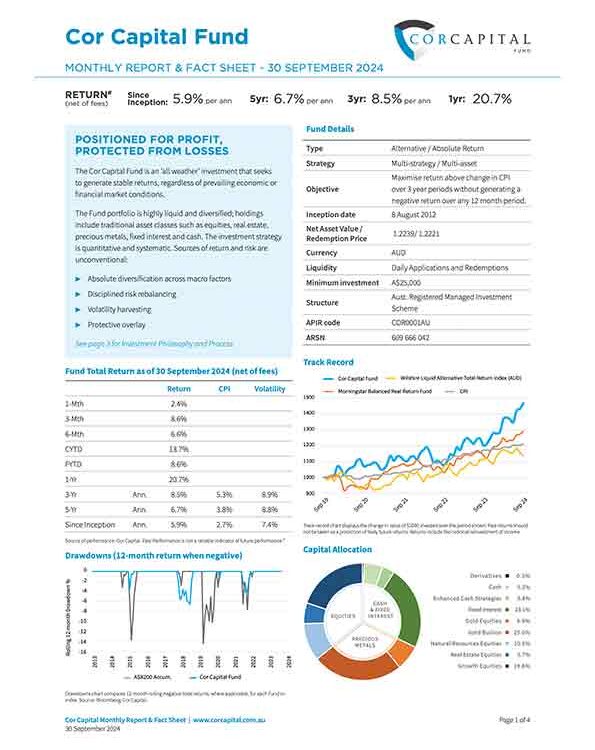
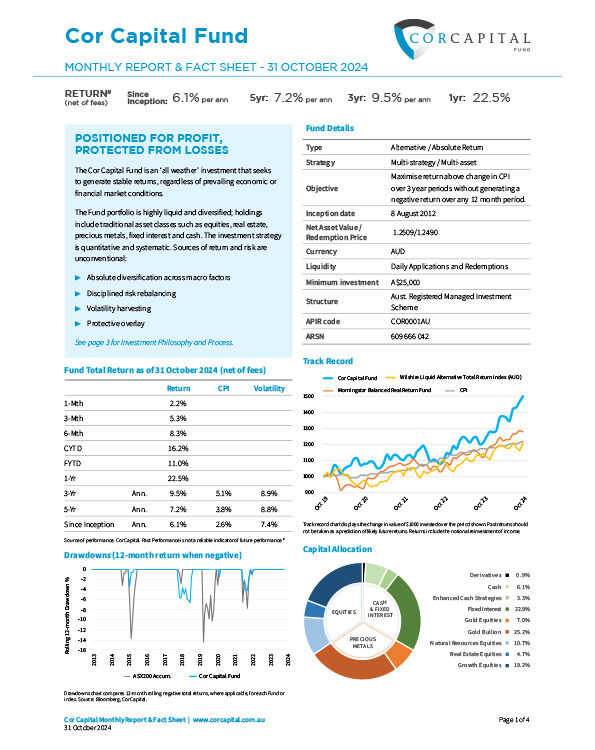
Track Record
Calendar Year Performance
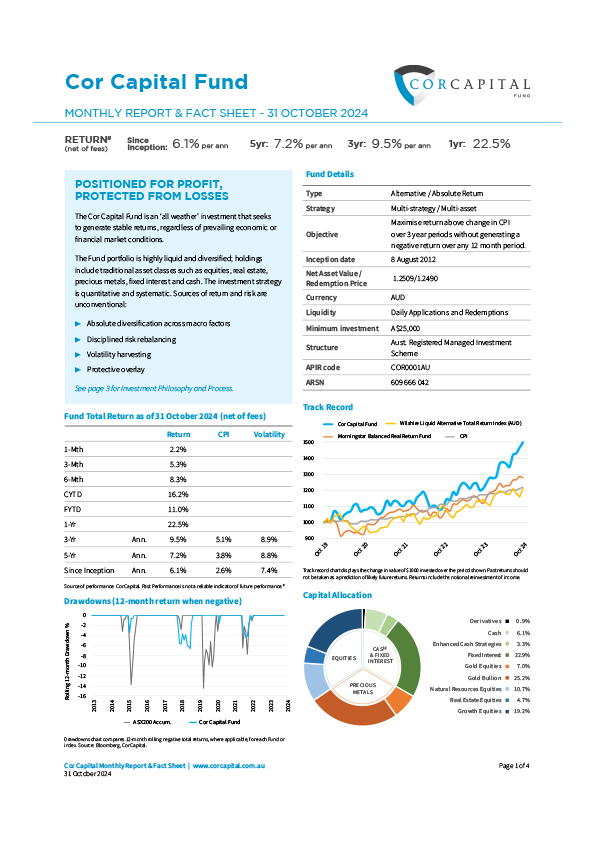
| % change calendar year | Jan | Feb | Mar | Apr | May | Jun | Jul | Aug | Sep | Oct | Nov | Dec | CYTD |
| 2024 | -0.35% | 0.76% | 6.16% | 0.59% | -0.87% | -1.50% | 5.38% | 0.65% | 2.36% | 2.20% | 16.16% | ||
| 2023 | 4.26% | -1.50% | 4.28% | 1.82% | -1.18% | -1.92% | 2.21% | 0.32% | -3.59% | 0.71% | 2.77% | 2.60% | 10.94% |
| 2022 | -1.92% | 3.61% | 1.60% | 1.43% | -3.73% | -4.81% | 0.94% | -0.95% | -1.87% | 1.86% | 4.23% | -0.60% | -0.63% |
| 2021 | -0.92% | -3.09% | -0.02% | 2.77% | 4.77% | -2.88% | 2.36% | -0.15% | -2.08% | -0.75% | 2.20% | 0.42% | 2.32% |
| 2020 | 5.87% | -1.33% | -3.82% | 2.61% | 1.49% | 0.70% | 3.56% | 0.20% | -3.95% | 0.75% | 0.16% | 1.17% | 7.19% |
| 2019 | 0.46% | 1.92% | 0.17% | 1.12% | -0.01% | 2.42% | 1.57% | 1.73% | 0.04% | -0.12% | 0.71% | -0.05% | 10.37% |
| 2018 | -1.64% | 3.31% | -0.92% | 3.30% | 0.29% | 2.91% | -3.41% | -3.70% | -1.76% | -3.68% | -2.31% | 2.25% | -5.62% |
| 2017 | 0.20% | 0.63% | 0.70% | 0.60% | 4.38% | -0.93% | 3.03% | -1.52% | 3.33% | 0.83% | 1.34% | 2.33% | 15.80% |
| 2016 | 0.43% | 3.57% | -0.44% | 2.59% | 0.59% | 1.45% | 1.73% | -0.50% | -0.21% | -1.71% | -0.71% | 1.29% | 8.26% |
| 2015 | 4.00% | 0.56% | -0.40% | -0.65% | 1.23% | -2.29% | 0.20% | -0.34% | -0.66% | 1.67% | -3.04% | -0.12% | 0.00% |
| 2014 | 0.92% | 2.34% | -1.34% | 0.51% | -0.26% | 0.76% | 1.01% | 0.10% | -1.03% | -0.13% | 0.48% | 1.93% | 5.37% |
| 2013 | 1.56% | 0.63% | -0.83% | -0.35% | -0.28% | -3.61% | 4.71% | 2.14% | -1.49% | 0.56% | -0.90% | -0.22% | 1.70% |
| 2012 | - | - | - | - | - | - | - | 2.03% | 2.25% | 0.02% | 0.16% | 0.13% | 4.64% |
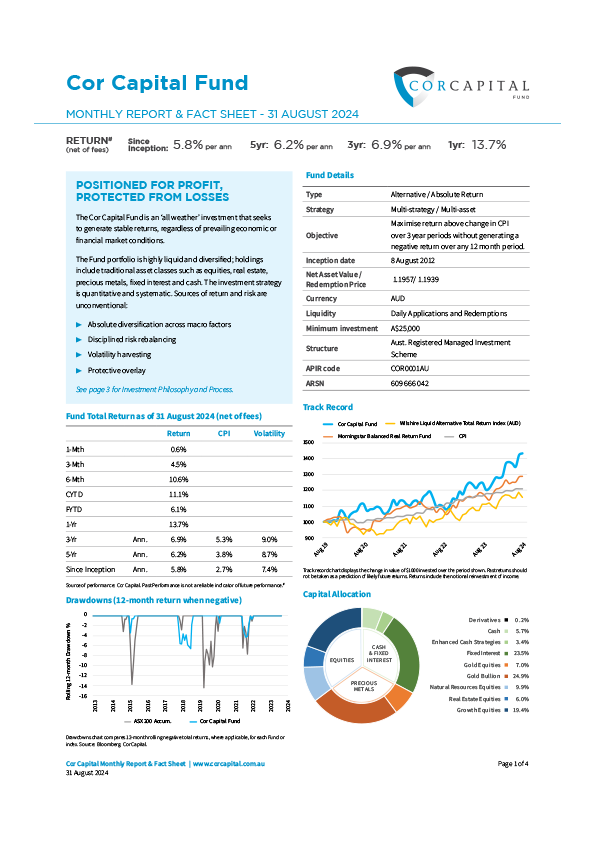
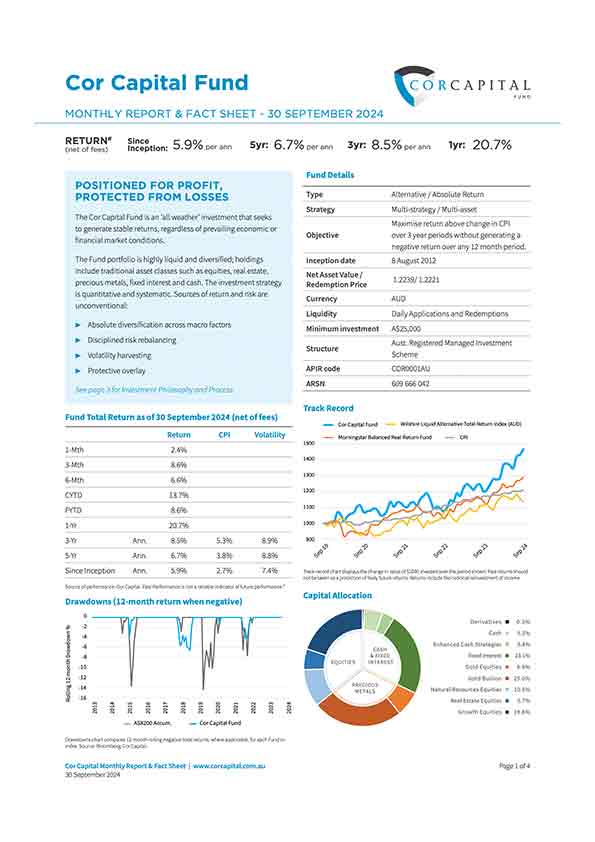
Latest Monthly Reports
Most economists, when modelling market behaviour, tend to sweep major fluctuations under the rug and assume they are anomalies. What I have found is that major rises and falls in prices are actually inevitable. – Benoit Mandelbrot
Invest Here
How to invest directly.
- Review the Offer Document and Reference Guide.
- Click on the appropriate button below to start your online application.
- Alternatively, download the Application Form and follow the instructions.
How to Invest via Third Party Platforms
(including superannuation).
A platform or a 'wrap' account combines your investments such as listed securities, managed funds and shares, into one account, eliminating some of the administrative burden and paperwork that usually comes with managing individual investments separately.
Some wrap platforms are also superannuation funds that you can join as a member. You choose the investments that make up your portfolio* and the platform provider will take care of all administration such as reporting of super contributions, payment of tax, and performance reporting.
*Limitations may apply.
The Cor Capital Fund is available for investment through these organisations and providers:
PRAEMIUM • CLEARSTREAM • HUB24 • MASON STEVENS • POWERWRAP • NETWEALTH • ONEVUE • NORTH


